insight Encyclopedia
Area Charts

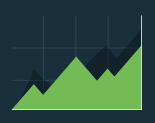
Like traditional line charts, area charts are set against a common scale and are ideal for showing trends in data over time. You might also add a trend line or goal line to illustrate performance in a certain period against a set benchmark.
Area charts are one of many types of data visualizations used to organize and present data in a way the audience can understand and take action on. To ensure visualizations have real business value, it’s important to know which types of visualizations are best suited for a given data set.