insight Encyclopedia
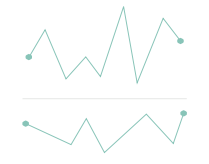
Sparkline Charts

Sparkline charts are one of many types of data visualizations used to organize and present data in a way the audience can understand and take action on. To ensure visualizations have real business value, it’s important to know which types of visualizations are best suited for a given data set.